

Mapping data can be accomplished using a variety of software such as Tableau, Power BI or MapPoint, but there are simple mapping capabilities in Excel (built into 2016 and later versions) which I find to be very useful. I typically use Excel for data review, network model inputs and network model results so having this capability in the software is a convenient feature.
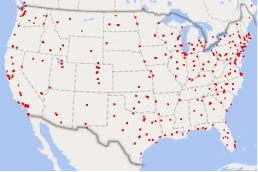 To illustrate this function, I have a simple data set with the following fields: Customer Name, City, State, Zip, and Demand. There is a menu item called 3D Map on the Insert menu. Click Open 3D Maps then select New Tour. This opens a new window in Excel with a map of the earth and the fields in your data set. The panel on the right side of the new window shows the parameters for the map. (Location, Height, Category, etc.) An easy map to create will show the customer locations in your data so choose City for the Location. Layer Options allows you to change the color and size of the markers on the map. The map on the left shows the customer locations in my data set.
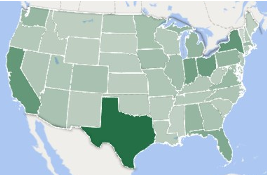
Taking this a step further you can create a heat map of customer demand (in lbs.) by state. To do this you must change the Location to State which will place a single marker in the center of each state. Then add a Height which will indicate the volume for that state. In this case select Demand for the Height and by default the map changes the single marker to a 3D bar with a height based on the total demand for that state – this just looks weird! Now change the visualization type from Stacked Column (the first option) to Region (the last option) and you’ll produce a heat map with the entire state filled.
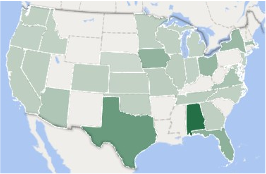
Finally, you can add a Filter which will allow you to display only a portion of the data. In the Filter drop-down box choose Customer Name and type anything that will restrict your data. With the sample data I set up a filter to display the client’s largest customer in a heat map by state.
The map is global so you aren’t restricted to the United States and there is additional functionality beyond the scope of my use. Overall, I’ve found that this is a convenient function to have in Excel!
—Dan Gunter, St. Onge Company