

Customer demand is a primary driver in network strategy decision making. I’ve been a network modeler for over 15 years and one practice I’ve found useful is to compare customer demand in a given project to the population dispersion from the US census.
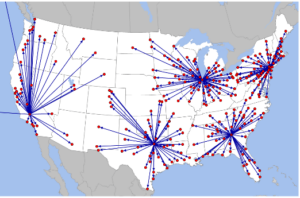
Many industries track population trends and the census data can give a rough estimate for customer demand. I’ve used the % of population by 3 digit master zip code to develop a fictitious customer demand set where the client either couldn’t get timely data or just wanted a quick approximation as to what a network would look like. For example, I’ve used the 2020 census data to create center of gravity models for 1 to 8 distribution center locations. The map shows the optimal locations for a five DC network from a center of gravity perspective. Newark NJ, Macon GA, Gary IN, Dallas TX and Bakersfield CA represent a very viable network similar to what we have seen in projects with concrete data so the population model is at least a valid starting point.
Another use of population data that I’ve found helpful is to compare the client data dispersion by state to the census data. It is very easy to highlight potential markets where there is “opportunity” to gain market share. Typically this would be used in future state modeling where the provided growth plan lacks regional bias. I’ve used the census data as an indication of what demand should look like in top markets like California and Texas then compared them to the actual client data. With respect to growth I increased California and Texas customers to reflect population then kept all remaining customer volume at a flat rate of growth.
Consider the following example:
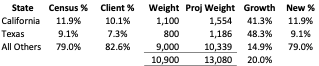
Growth is projected to be 20% over the next 3 years and the proportion of California and Texas demand should better reflect population trends. The rates required in California and Texas are much higher than the rest of the country in order to maintain an overall rate of 20% while adding some regional bias to the growth.
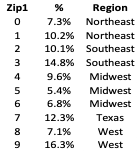
Similarly I’ve used population at a regional level as a comparison point to client data. Using the one-digit zip code to reflect regions of the US, you can use the same technique above to add regional bias on a broader level. Overall I have found that using population data aids in performing a more robust client analysis!
—Dan Gunter, St. Onge Company