 Strengthening your supply chain one link at a time.
Inflation continues to be one of the main issues for the economy. While the Consumer Price Index (CPI) is a well-known indicator for measuring inflation there is another index that also performs the same function. The lessor known Personal Consumption Expenditures (PCE) is an index that also measures price changes. Both measures help the Federal Reserve make policy decisions for guiding price changes and both indexes to a target level of 2% annually. Historically these two indexes generally move together. But in the past 18 to 24 the two measures have seen a deviation on reporting the rate of inflation.
Difference between the PCE vs CPI
The Personal Consumption Expenditures (PCE) is a monthly economic report from the Bureau of Economic Analysis. Like the CPI, it is a metric that tracks what US consumers pay for goods and services. The CPI is reported by the Bureau of Labor Statistics. There are four main differences between the two indexes: different formulas used for the two indexes, consumption category weighting, scope as in the difference of consumer items measured, and other reasons.
The formula difference discussion can get complex. The summary is that the PCE more easily allows for customer substitutions. For example, if the price of one product rises and consumers choose another like product to substitute the PCE allows the substitution and the change in prices are less than the CPI. An example is substituting a different protein (meat vs chicken) or vegetable or dairy item.
Consumption category weighing is another reason for the difference. Each index uses the data it collects to calculate the components of the entire index. For example, housing price increases are treated differently in each index. Housing in the PCE compromises approximately 16% of the PCE and 33% in the CPI. Thus, the drastic increases in housing costs are reflected as a greater component in the CPI than the PCE. Another example is Healthcare in the PCE is 17% of the index while only 7% in the CPI.
The two indexes have different scopes. For example, healthcare is treated differently in each index. The CPI reports consumer healthcare out of pocket consumer expenses while the PCE includes third party expenditure like private healthcare insurance expenditures and government expenditure like Medicare.
The Other category are seasonality and other measure differences.
Historical Divergence Between the PCE and CPI
While the differences in the composition of the respective indexes seem technical the two indexes typically align very well against each other.
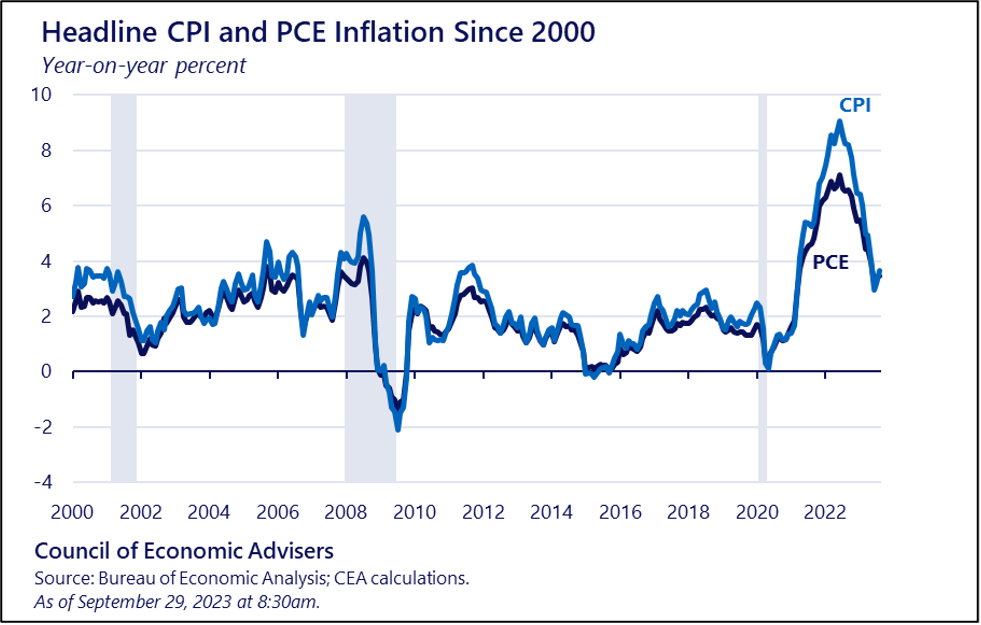
However, the past two years have seen the CPI rise higher than the PCE. The chart below shows how the CPI and PCE trend since from the year 2000. The CPI annual rate came in at 3.4% in April 2024. The PCE for April 2024 was 2.7%.
The faster decline in the PCE can be attributed in part to how the indexes treat housing and healthcare. Housing has seen a historical run up in home prices and rent that are not sustainable in the long term. Having housing as a greater component of the index will naturally keep the CPI higher. Also, a faster decline in PCE Healthcare will also continue to exacerbate the differences in the two indexes.

So which index is most accurate?
Both measures have their strengths and weaknesses. The Fed takes both measures into account to adjust policy in order to achieve their goal of 2% inflation. There are some upcoming reporting changes coming to the CPI that will help bring the CPI more in line with the PCE. But the unique dynamic with component prices of each index are causing a unique situation.
What is next for Inflation?
Both the PCE and CPI will continue to provide important sources of information to help businesses and households make financial and consumption decisions. The question still remains: Will the current interest rates set by the Federal Reserve do enough to slow down the overall rate of inflation? So far, the data shows a slowing down of price increases from the period in 2022-23. The recent bump up in prices has cause for concern. It is still too early to make a bold prediction on the direction of future prices. And this is highlighted by the relative inconsistency of the CPI and PCE.
—Tom Schaefges, St. Onge Company